Every rig.
Every screen.
Live.
NRG-Drill streams drilling data from every rigsite cabin to your office, your phone and the wall — live charts, alarms checked on the server, and dashboards your whole team can share.
- Tracks × channels
- 4 × 6
- Rows lost offline
- 0
- Scroll-back
- 48 h
- Ancer
- WITS Level 0
- TCP server & client
- RS-232 serial
- SQL Server
- Custom SQL
- LAS 2.0
- CSV
- SignalR live push
- Gzip batches
- Offline buffer
Today
Rig data is stuck in the cabin.
- The live screens are in the cabin, and the people deciding are not.
- Remote desktop over a satellite link, one viewer at a time.
- Screenshots of the chart sent round on WhatsApp.
- When the link drops, the data for that hour is gone.
With NRG-Drill
It's everywhere, at once.
- Every rig, live, in any browser, for everyone with access to the well.
- One stream per cabin, pushed to unlimited viewers by the cloud.
- The real chart, with 48 hours of scroll-back and a shared time cursor.
- Rows buffer at the rigsite and arrive in order when the link returns.
How it works
From the cabin to every screen,
in about five seconds.
Scroll to follow one reading from the rig’s database to the people who need it, including what happens when the link drops.
How data travels
01 / 05
Read at the rigsite
The Transmitter reads new rows from the rig’s database (Ancer), a WITS Level 0 feed or your own SQL query, from a saved cursor, so nothing is missed or sent twice.
02 / 05
Sent in compressed batches
Readings leave the cabin as gzipped batches over outbound HTTPS. There are no inbound ports to open and no VPN to keep alive.
03 / 05
The link drops. Nothing is lost.
When the satellite or 4G link goes down, rows wait in a local buffer, tagged with their well. The rig carries on as normal.
04 / 05
Back online, oldest first
As soon as the link returns, the buffer empties in order, so the chart in town fills in exactly as it happened on the rig.
05 / 05
Every screen, at once
The cloud stores each value, checks the alarm rules and pushes the reading live to everyone on the well: in the office, on a phone, or on a wall display.
The product
Everything the rig shows,
wherever you are.
The same information as the legacy rig screens, in a modern product that doesn't need a VPN.
Product features
Live charts
The drilling chart you know, in a browser.
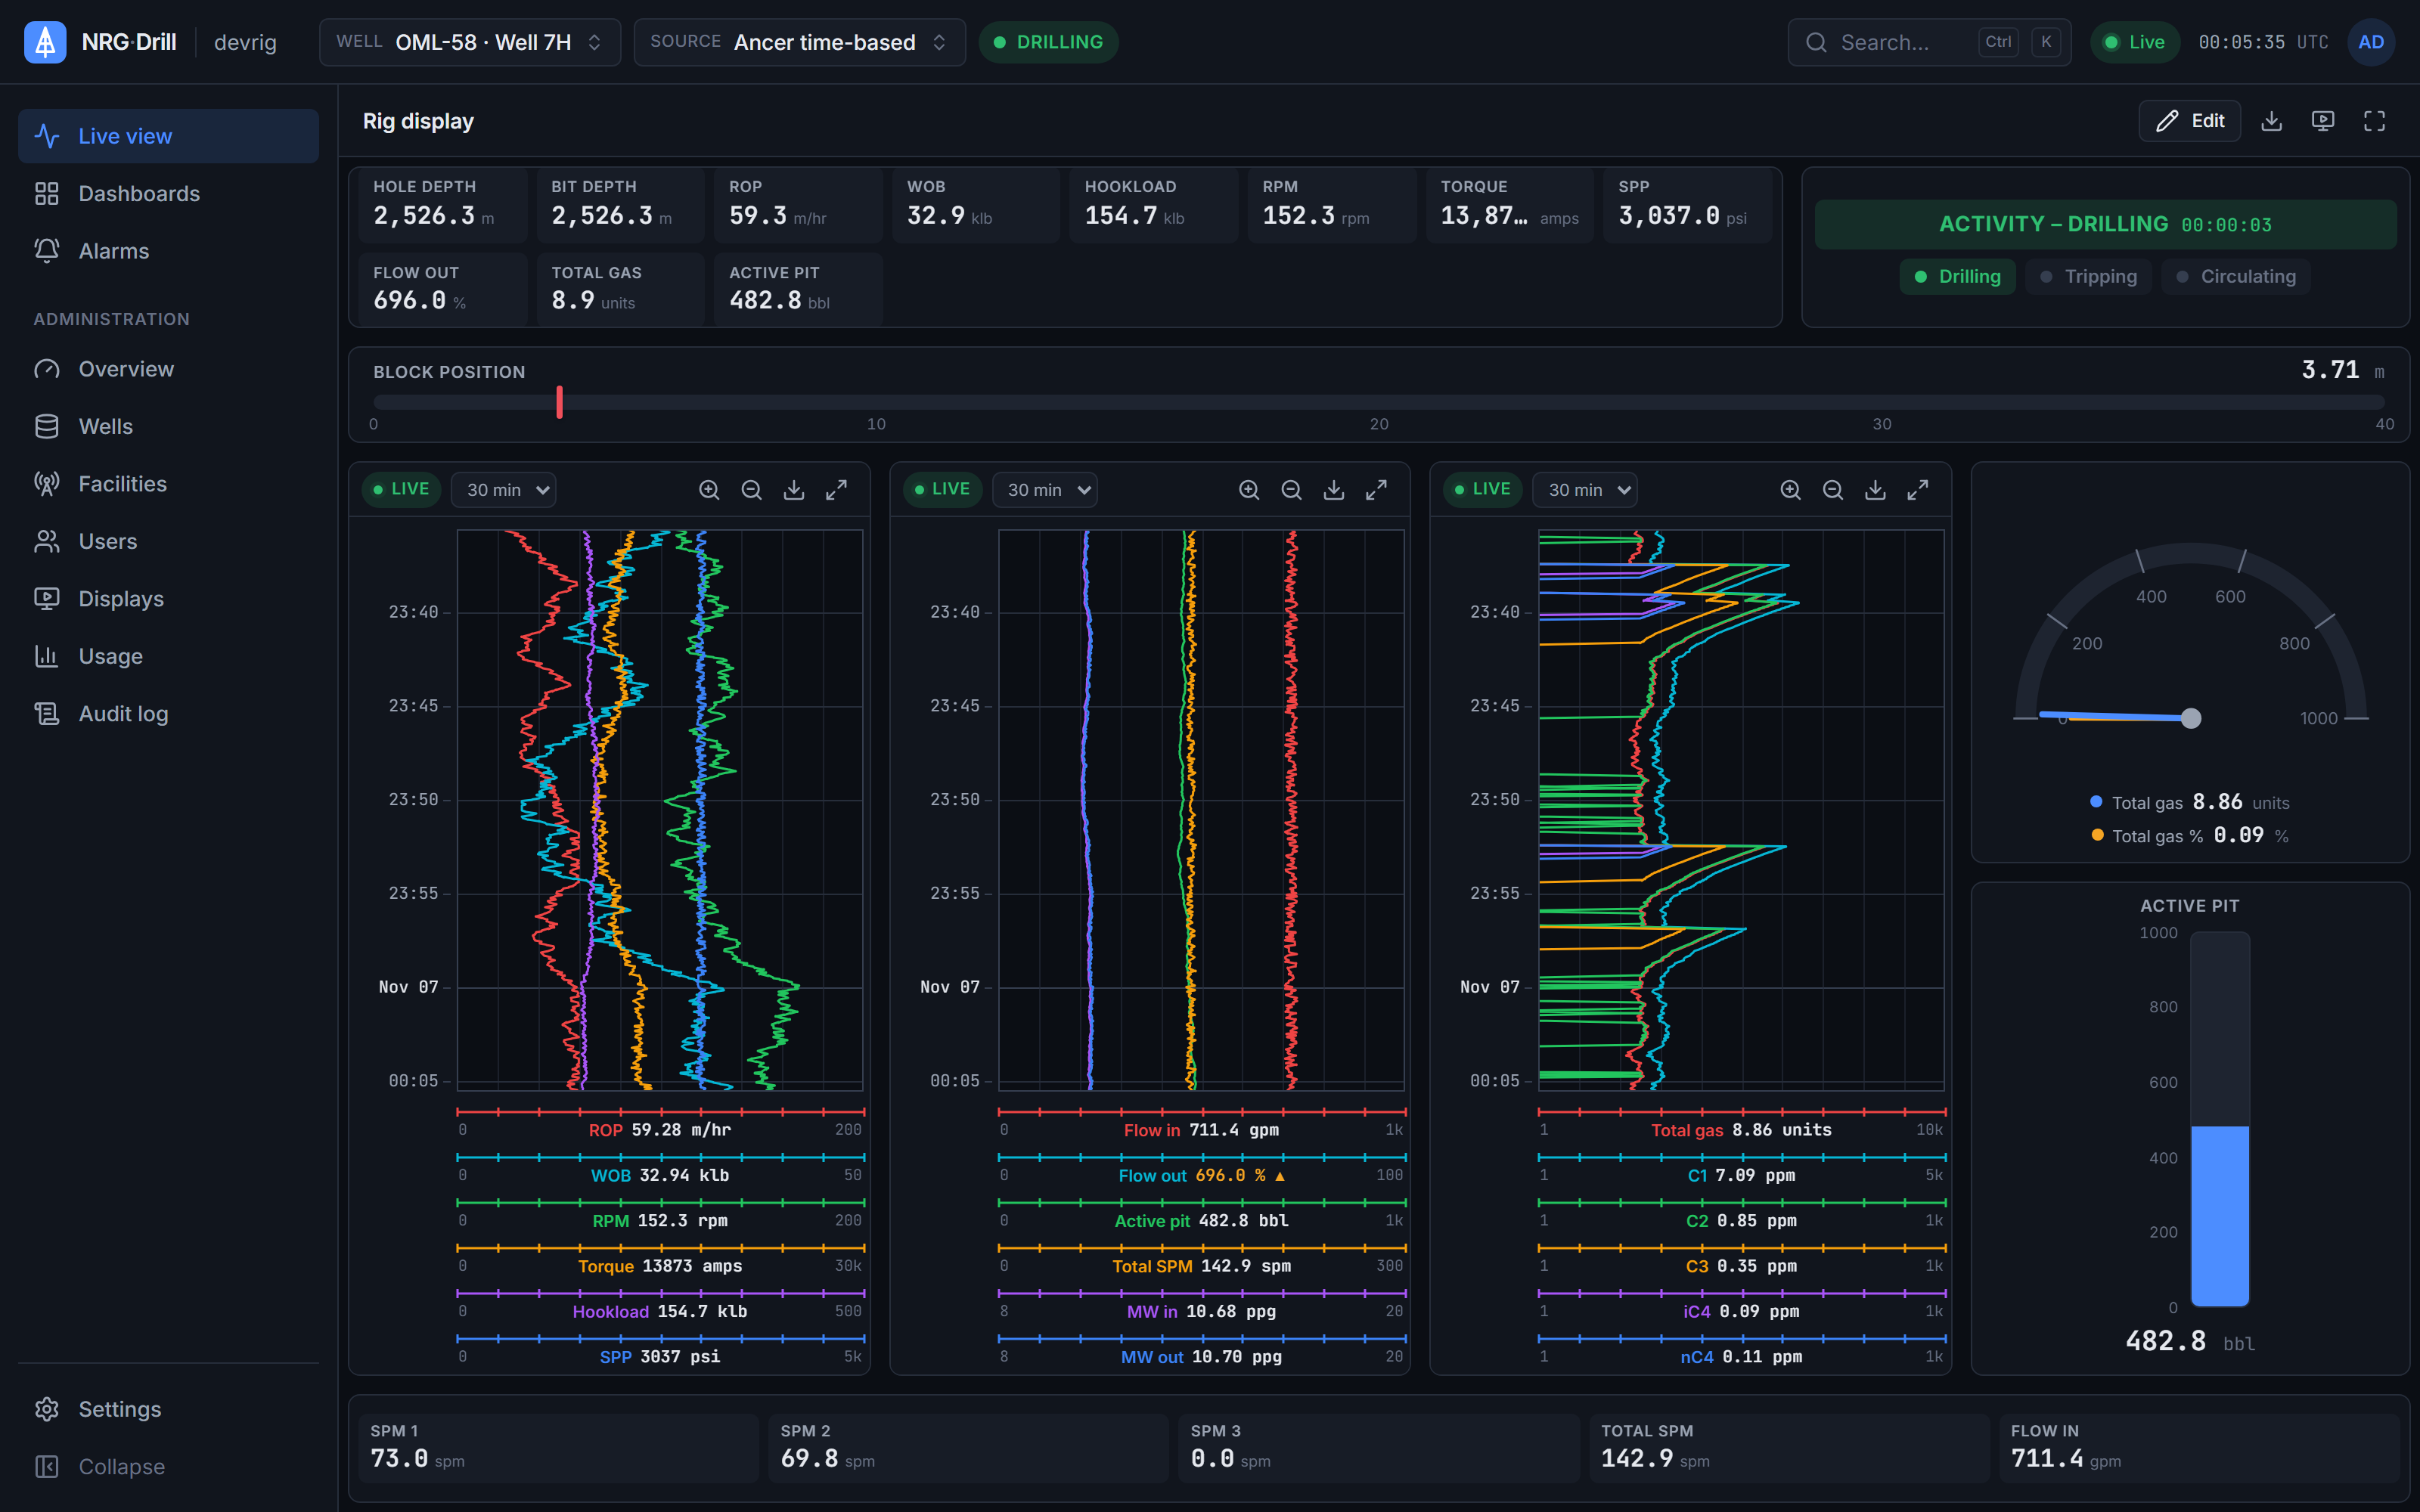
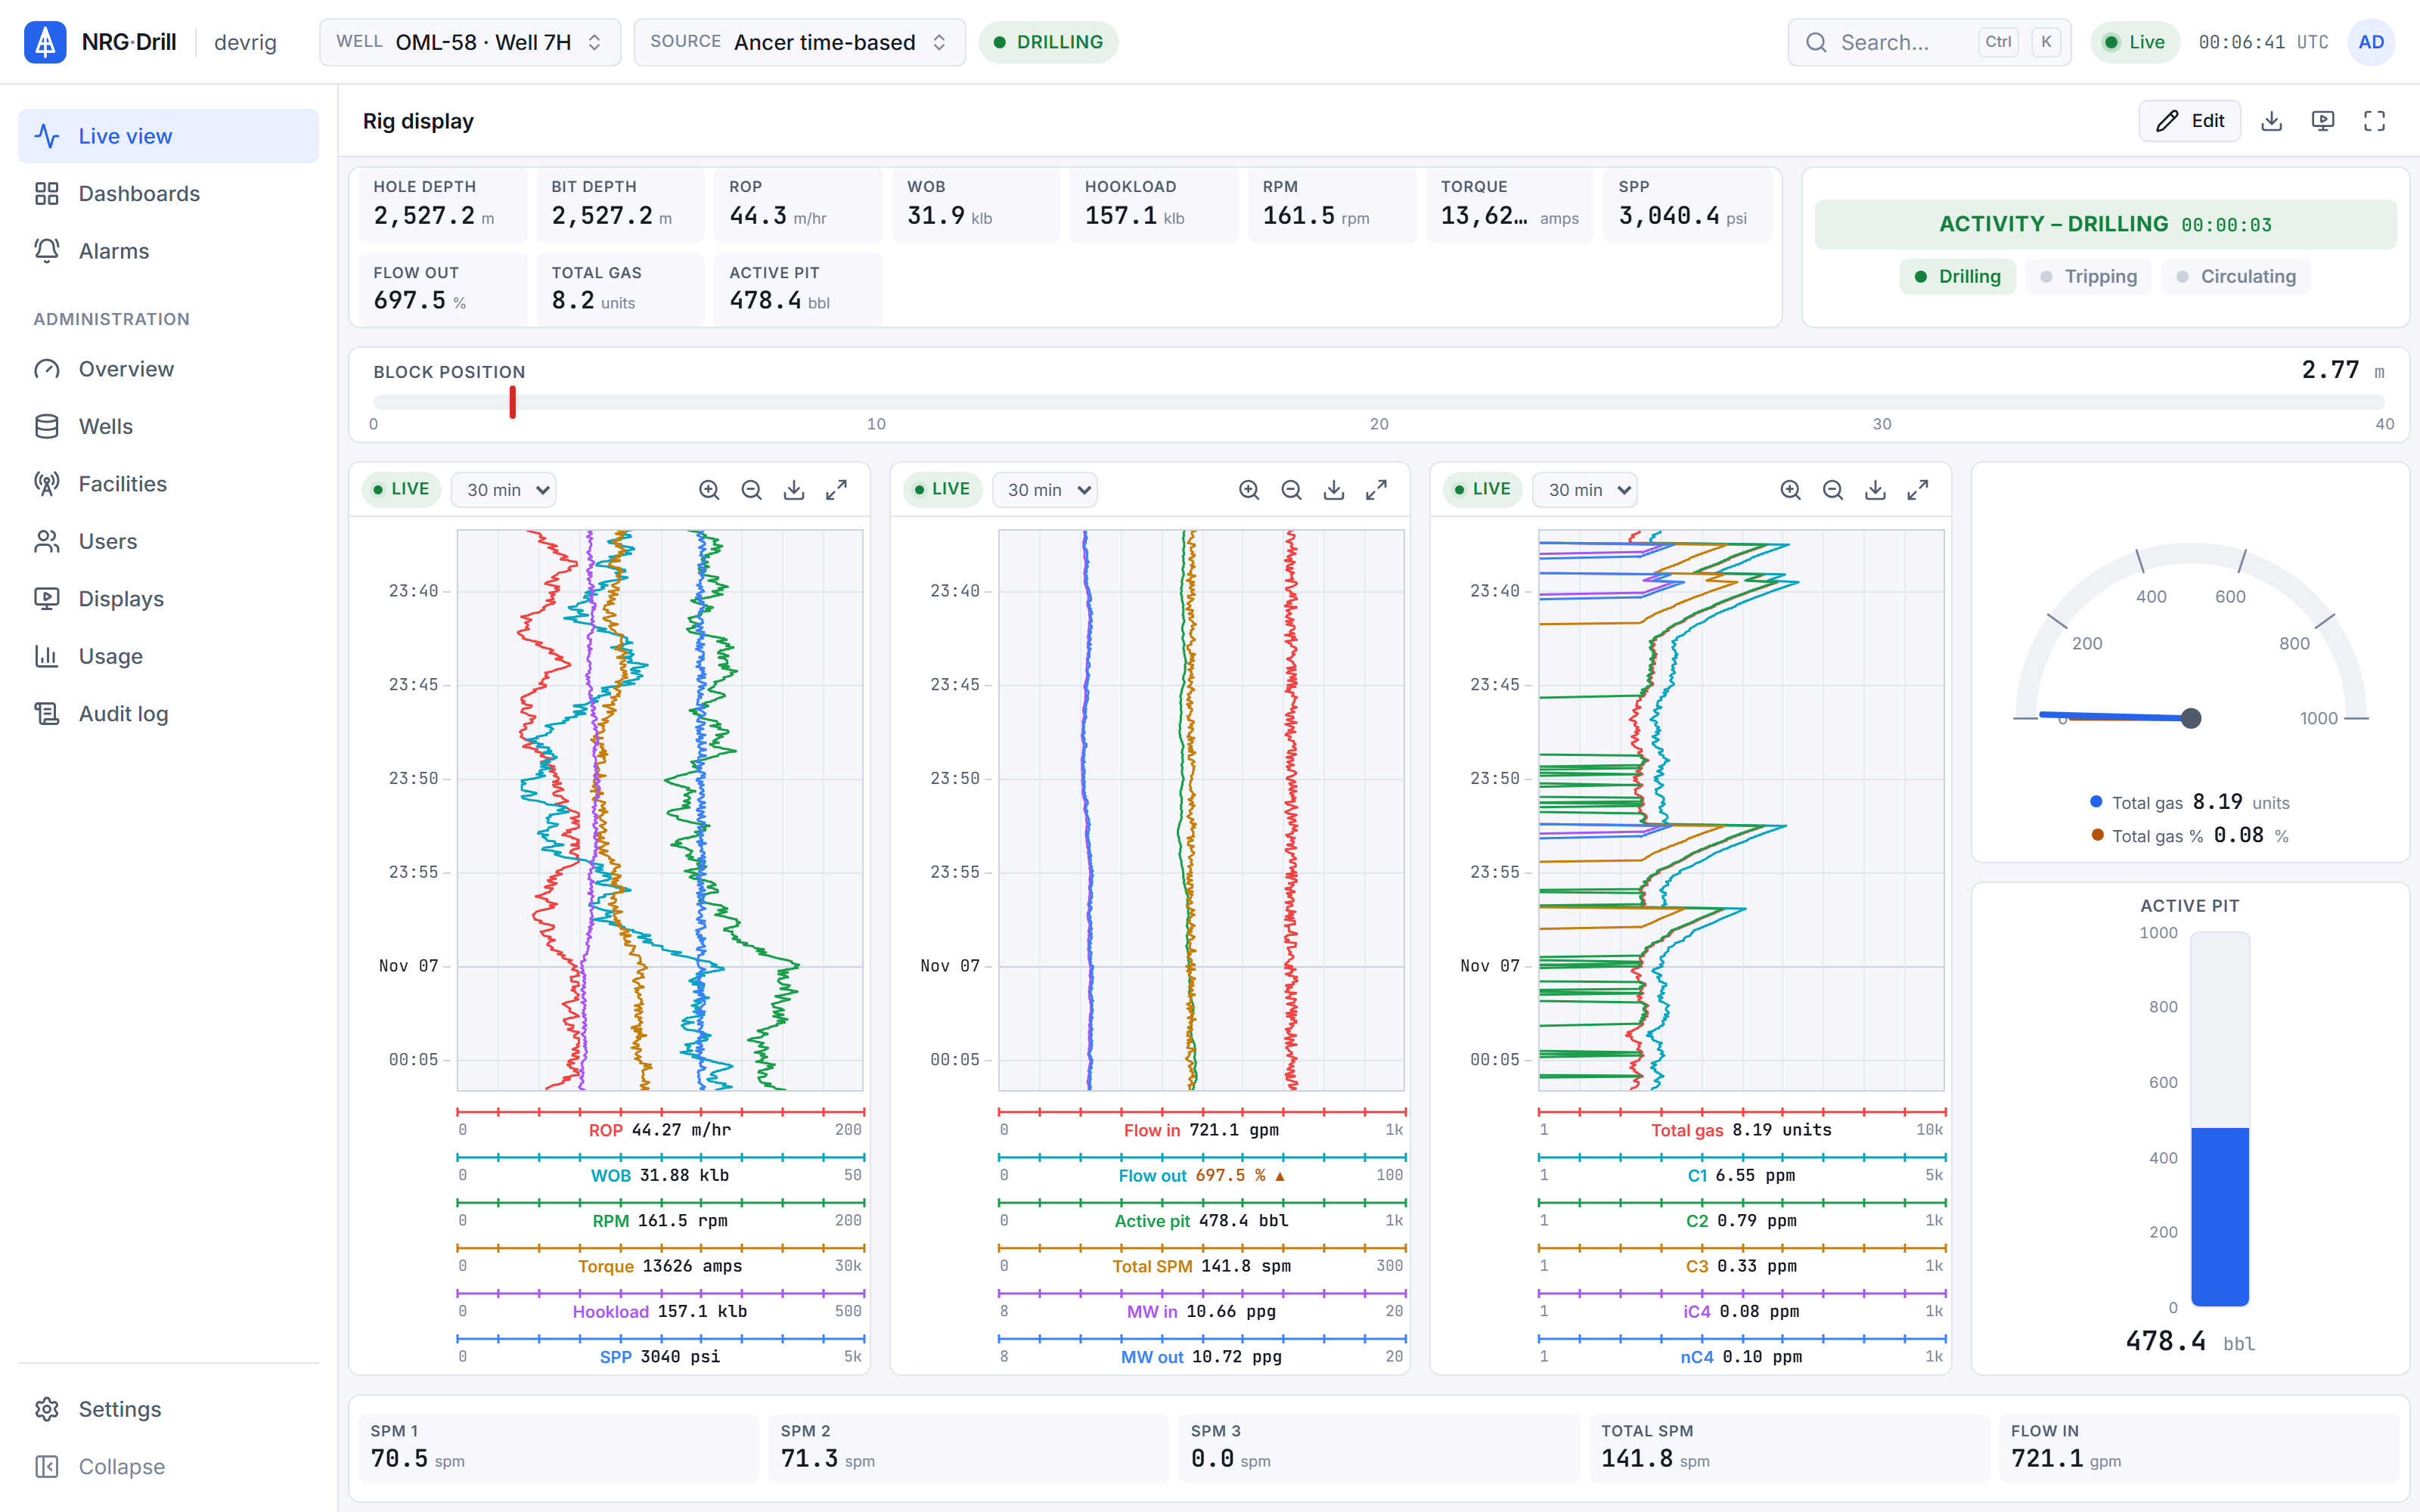
Top-down, newest at the bottom, up to 4 tracks × 6 channels. Scroll back 48 hours, zoom with Ctrl+wheel, and hover to read any value.
Alarms
Checked on the server, heard on every screen.
Above or below a limit, rises or falls by an amount in a time window (kicks and losses), or no data. Acknowledged once for everyone.
Wall displays
Pair a screen in seconds. It doesn't use a seat.
Enter this code in Admin → Displays
7K4Q9X
Dashboards
Drop a widget on an edge to split.
Several sources
Ancer, WITS or your own SQL.
Each source keeps its own dataset. Dashboards carry over because WITS codes map to the same channel names.
Export
CSV or LAS 2.0, for any range up to 31 days.
Units & time zones
Metres or feet. Well time, your time or UTC.
Per person, with an organisation default. Stored data never changes; only labels and readings convert.
Bit depth
2,418.6 m
7,935.0 ft
Time
14:32 WAT
07:32 CST
Shared time cursor
Click a moment. Every widget shows it.
Charts pause there with a marker and gauges show the values at that time. "Back to live" returns you to now.
The real thing
This is the product. No mock-ups.
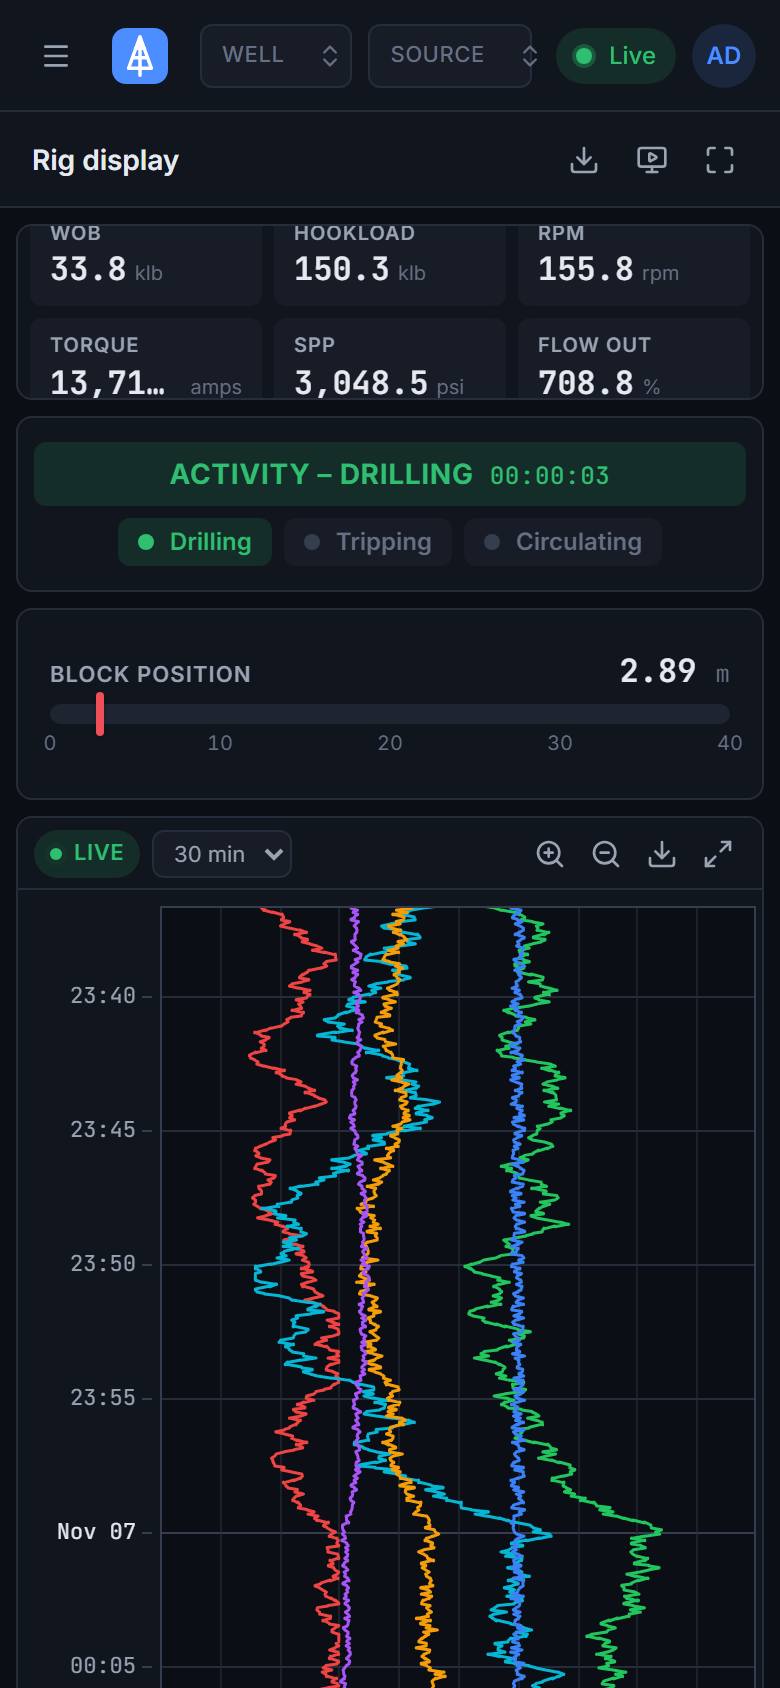
Every screen on this site is the NRG-Drill web app running on a simulated rig, the same app your team will sign in to.
Product screenshots
Dashboards
Build the screen your rig team already knows.
Charts, gauges, value strips, gas bars, level bars and annotation feeds, arranged in a split layout you resize by dragging. Start from the Rig display template or build your own.
Dashboard widgets
ROP
–
m/h
WOB
–
klb
RPM
–
rpm
Torque
–
kft·lb
SPP
–
psi
Flow in
–
gpm
SPP psi
Active pit
– bbl
Gas · %
Activity
Rotary drilling
Try it
Catch the kick before the trip tank does.
Rises-by and falls-by rules watch for a change within a time window, such as a pit gain, a drop in flow out or a jump in gas. Drag the slider and see what your team would see.
Alarm demo
Rule · organisation
Pit gain
Active pit rises by ≥ 5 bbl within 10 min → Critical
warning at ≥ 3 bbl · heard by everyone on the well
Alarm log
- 14:20:05Rule armed · baseline 452.0 bbl
Security
Your rig data stays yours.
Drilling data is commercially sensitive. NRG-Drill is built so each organisation is isolated, every screen is accounted for, and you can always take your data out.
Security
A schema per organisation
Each organisation’s data lives in its own database schema, so a query from one company can’t reach another’s.
Hashed transmitter keys
256-bit random keys per cabin, stored only as SHA-256 hashes. Revoke a key and that cabin stops sending at once.
Access per well
Viewers see only the wells they’ve been granted. Live connections are checked against the same grants.
One session per person
Signing in on a new device ends the old session immediately, live connections included, and tells the old device where.
Location restriction
Limit sign-ins to the countries you operate in, with exemptions for travelling staff.
Audit trail
Sign-ins, failed attempts, password resets, licence changes and exports are recorded, and your admins can read them.
Rollout
Live in an afternoon.
No servers to install, no VPN, no changes to the rig’s own systems.
Rollout steps
- 1
Install the Transmitter
A small Windows app on the cabin PC that can read the rig database or WITS feed. Outbound HTTPS only.
- 2
Pair it with a facility key
Create the cabin in Admin → Facilities and paste its key. The cabin picks the well it’s on.
- 3
Pick a dashboard
Start from the Rig display template, or build your own and share it with the organisation.
- 4
Watch it live
Invite engineers, pair the wall display, and set your alarm rules. The data starts flowing within seconds.
What do we need to install at the rigsite?
Only the NRG-Drill Transmitter, a small Windows app, on a PC in the cabin that can reach the rig’s database or WITS feed. It connects out over HTTPS; there are no inbound ports to open and no VPN.
What happens when the satellite or 4G link goes down?
The Transmitter keeps reading and stores the rows in a local buffer, tagged with their well. When the link comes back it sends them oldest first, so the chart in town fills in exactly as it happened. Only rows the server actually rejects count as failed.
How live is "live"?
The Transmitter reads new rows every few seconds, and each reading is pushed to every open screen on the well as soon as it’s stored. In practice the delay is a few seconds, depending mostly on the rig’s link.
Who owns the data?
You do. We process it on your behalf to provide the service. You can export it at any time, and on request at the end of your contract we delete it, as set out in our Data Processing Addendum.
How is NRG-Drill priced?
Each organisation has its own licence, sized by the number of users, wells and cabins, how long data is kept, and the features you need. Wall displays don’t count as users. We quote in US dollars or naira. Tell us about your operation and we’ll send a quote.
See your own rig, live, this week.
Book a 30-minute demo. We’ll show NRG-Drill on a live well and talk through connecting your first cabin.