Live charts
The drilling chart your crew knows, live in any browser.
Time runs down a shared ruler with the newest reading at the bottom, as on the rig screens. Each value arrives seconds after it leaves the cabin, and you can scroll back through the last two days without leaving the page.
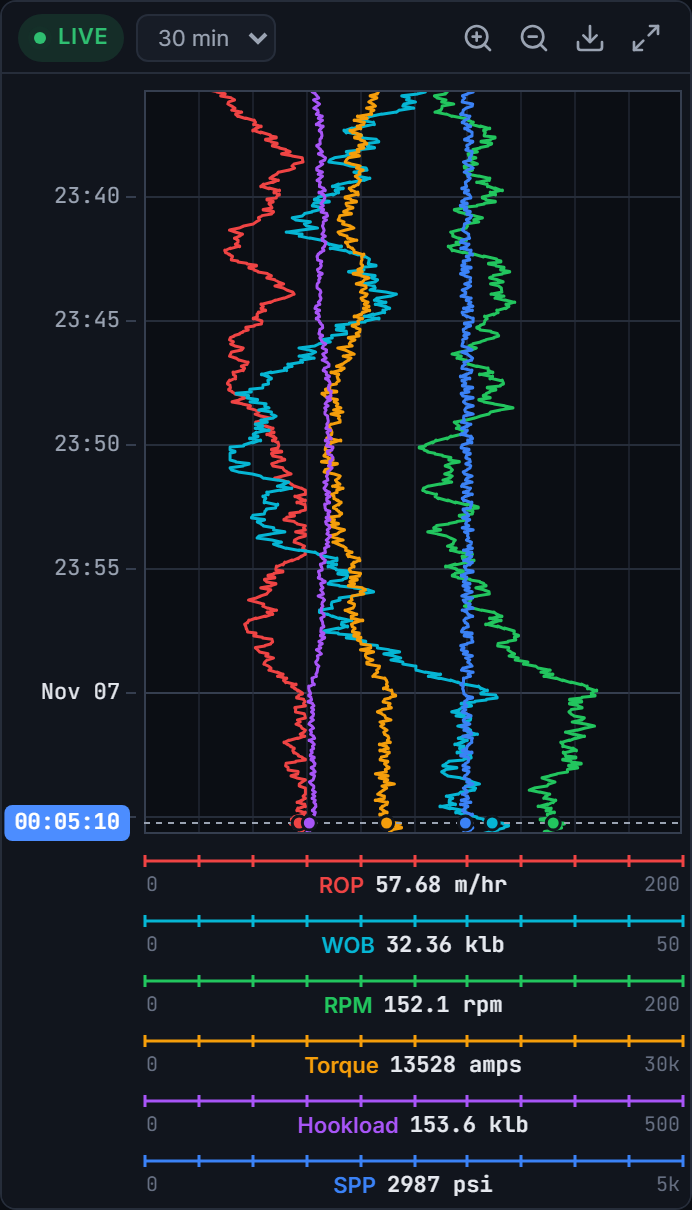
- Tracks × channels
- 4 × 6 per chart
- Scales
- Linear, Log10, split Linear/Log10
- Scroll-back
- 48 hours, loaded on demand
- Direction
- Newest at bottom or top, per person
- Times shown in
- Well time, your time zone or UTC
- Units
- m/ft, klb/kN, psi/bar, per person
Try it
Hover to read. Scroll the page to speed it up.
A simulated well drilling ahead, with a connection every few minutes and a gas peak after each one. The pause button freezes it, as scrolling back does in the product.
Top-down, like the rig screens
Time runs vertically with the newest data at the bottom by default, or at the top if that's how you read it. Each person chooses, starting from an organisation default.
- Up to 4 tracks side by side, each with up to 6 channels
- A colour-coded scale bar under every channel with its live value and range
- Drawn on canvas, so it stays smooth on a wall display or a laptop
The right scale for each channel
Pressures and loads read best on a linear scale, gas on a logarithmic one. The split linear/log scale shows the low range in detail without losing the peaks.
- Linear, Log10 and split Linear/Log10 scales
- Set the range per channel
Scroll back 48 hours
Scroll with the mouse wheel or drag to go back in time. The chart pauses, loads the history it needs as you go, and returns to live when you ask. Ctrl+wheel zooms, and hovering reads every value at that moment.
One moment, every widget
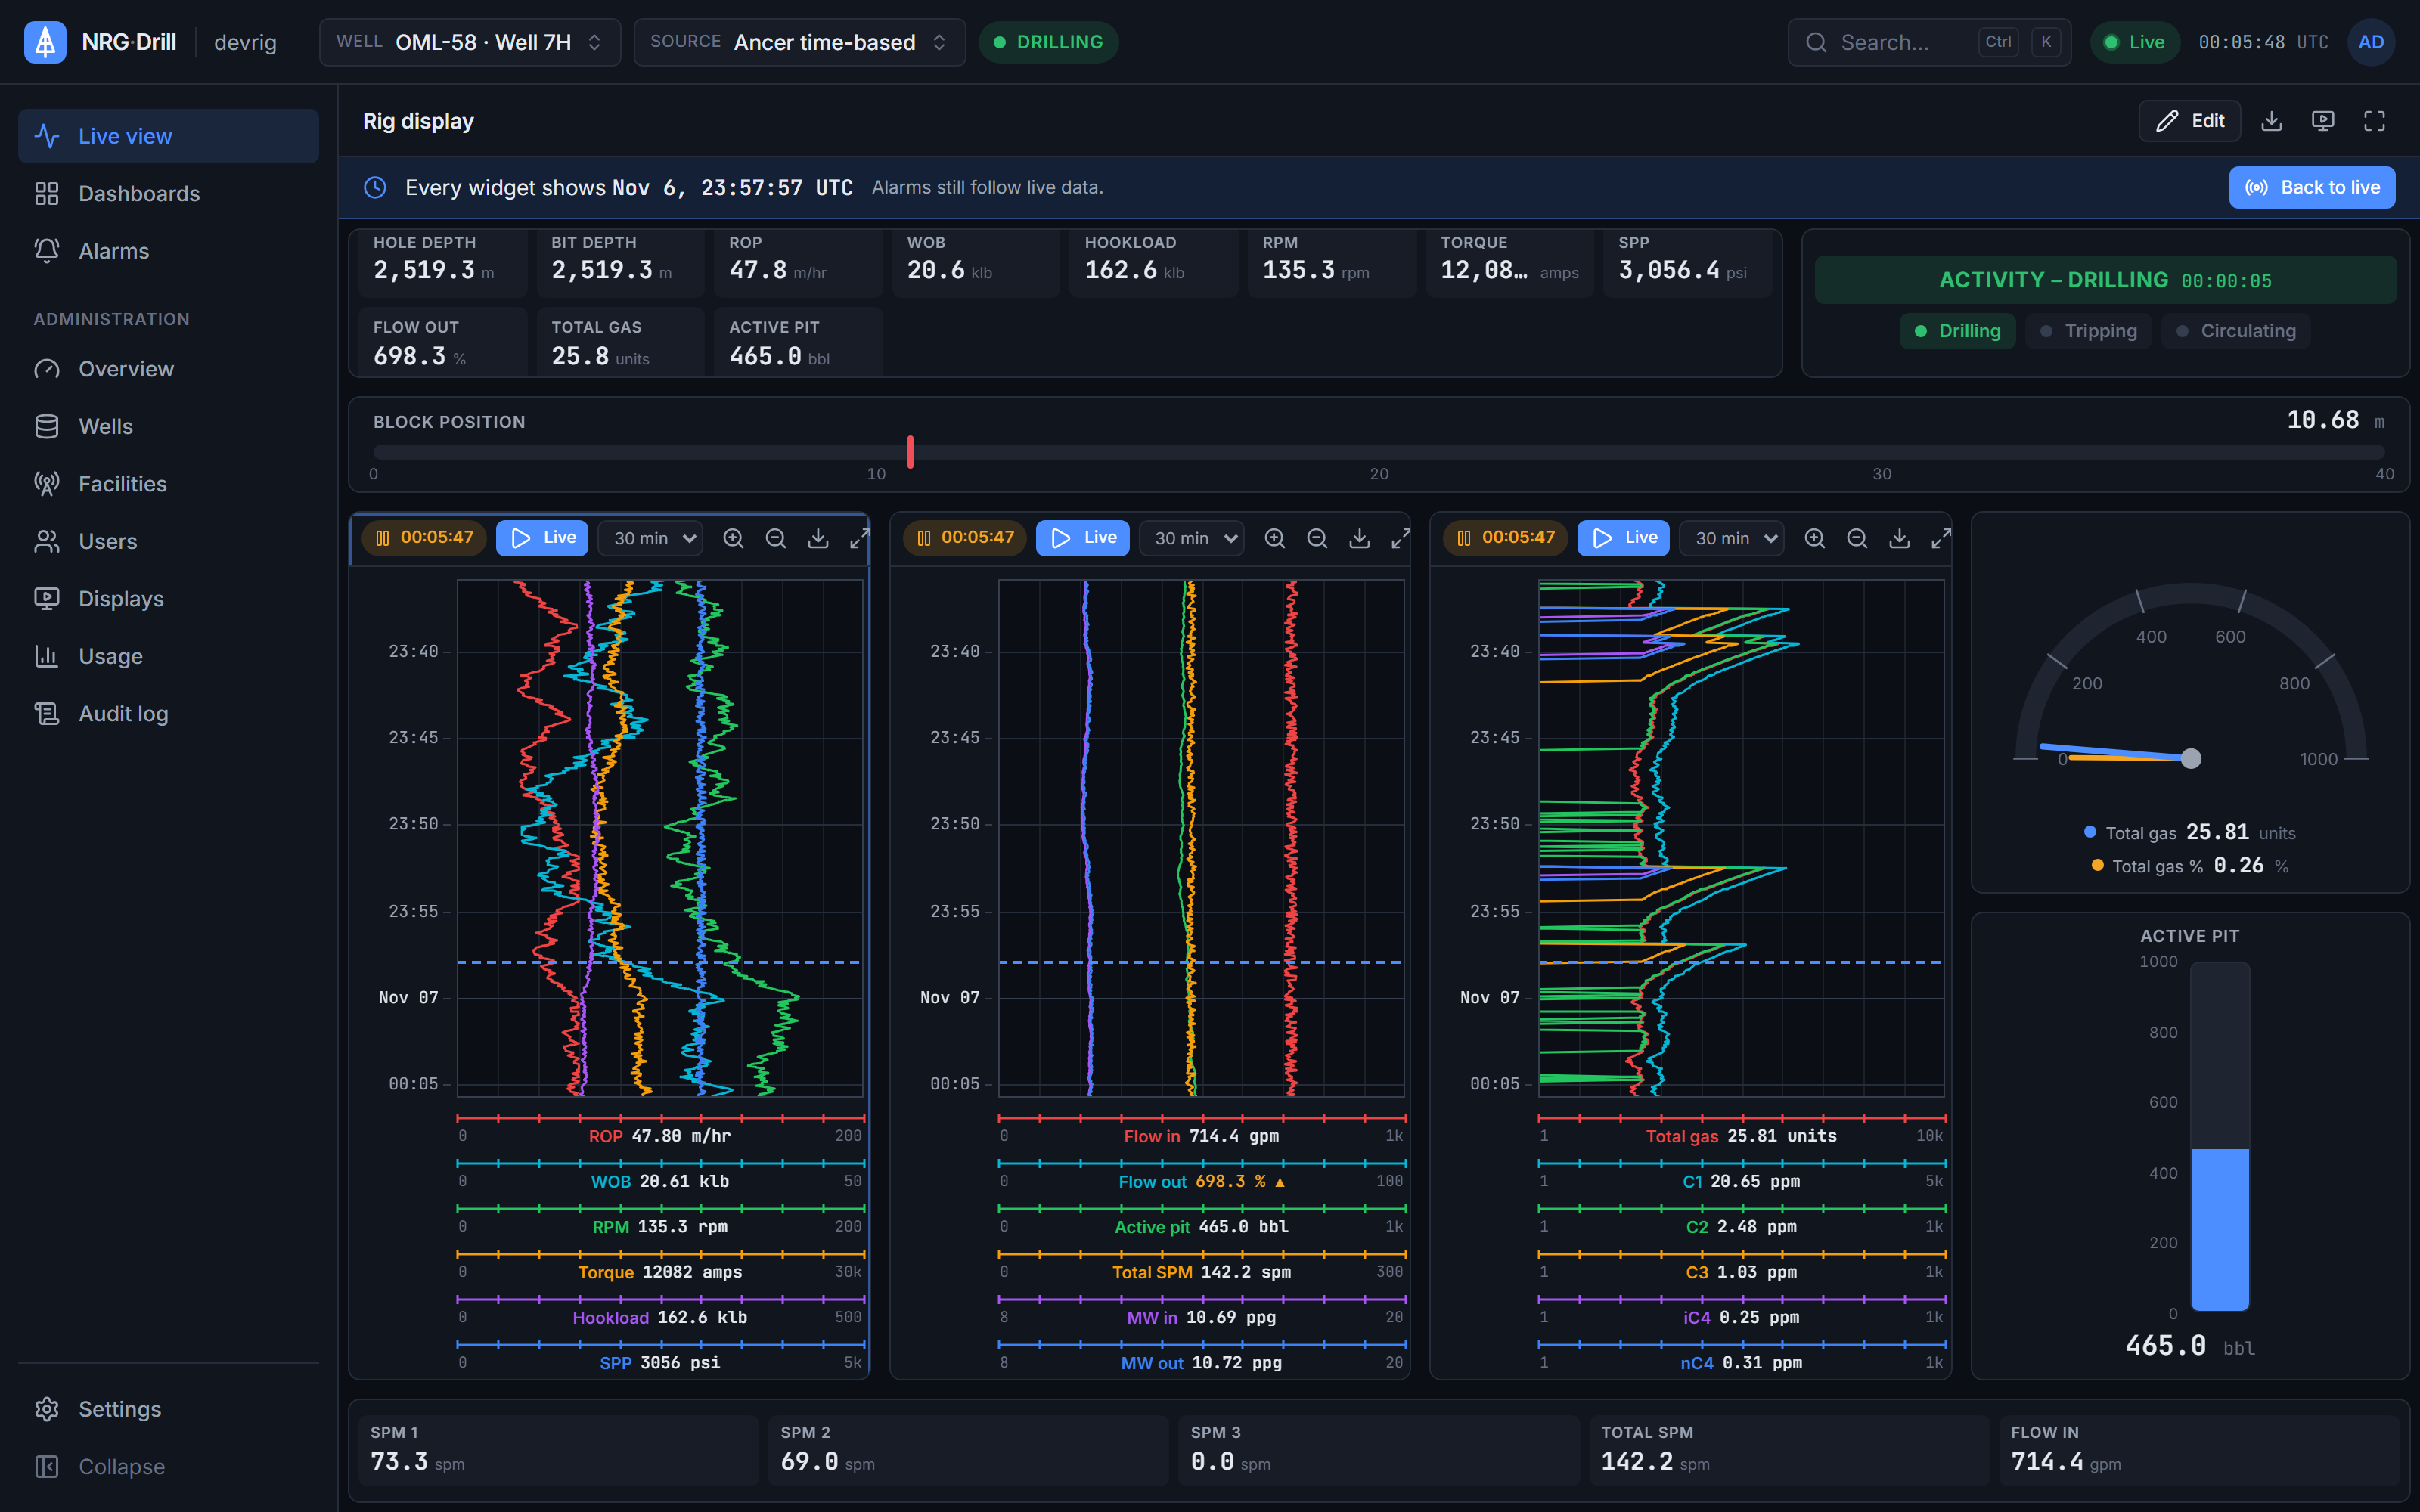
Click a chart or an annotation to pin a time. Every chart pauses there with a dashed marker, and gauges, value strips and labels show the readings from that moment. Press Esc or "Back to live" to return. Alarms, the activity indicator and the connection badge always stay live.
Annotations in context
Connections and notes logged at the rig arrive with the data and appear on the chart and in the annotation feed. Engineers can add their own from town.
Works with
Dashboards
A split-layout dashboard designer with 11 drilling widgets, templates, organisation and personal dashboards, undo/redo, JSON import/export and a kiosk view.
Learn moreAlarms
Server-side drilling alarms — limits, rises-by and falls-by for kicks and losses, and no data — acknowledged once for everyone, with shelving, quiet hours and an alarm log.
Learn moreExport
Export any well's data as CSV or time-indexed LAS 2.0, for up to 31 days at a time, from any source.
Learn moreSee your own rig, live, this week.
Book a 30-minute demo. We’ll show NRG-Drill on a live well and talk through connecting your first cabin.