Dashboards
Build the screen your rig team already knows.
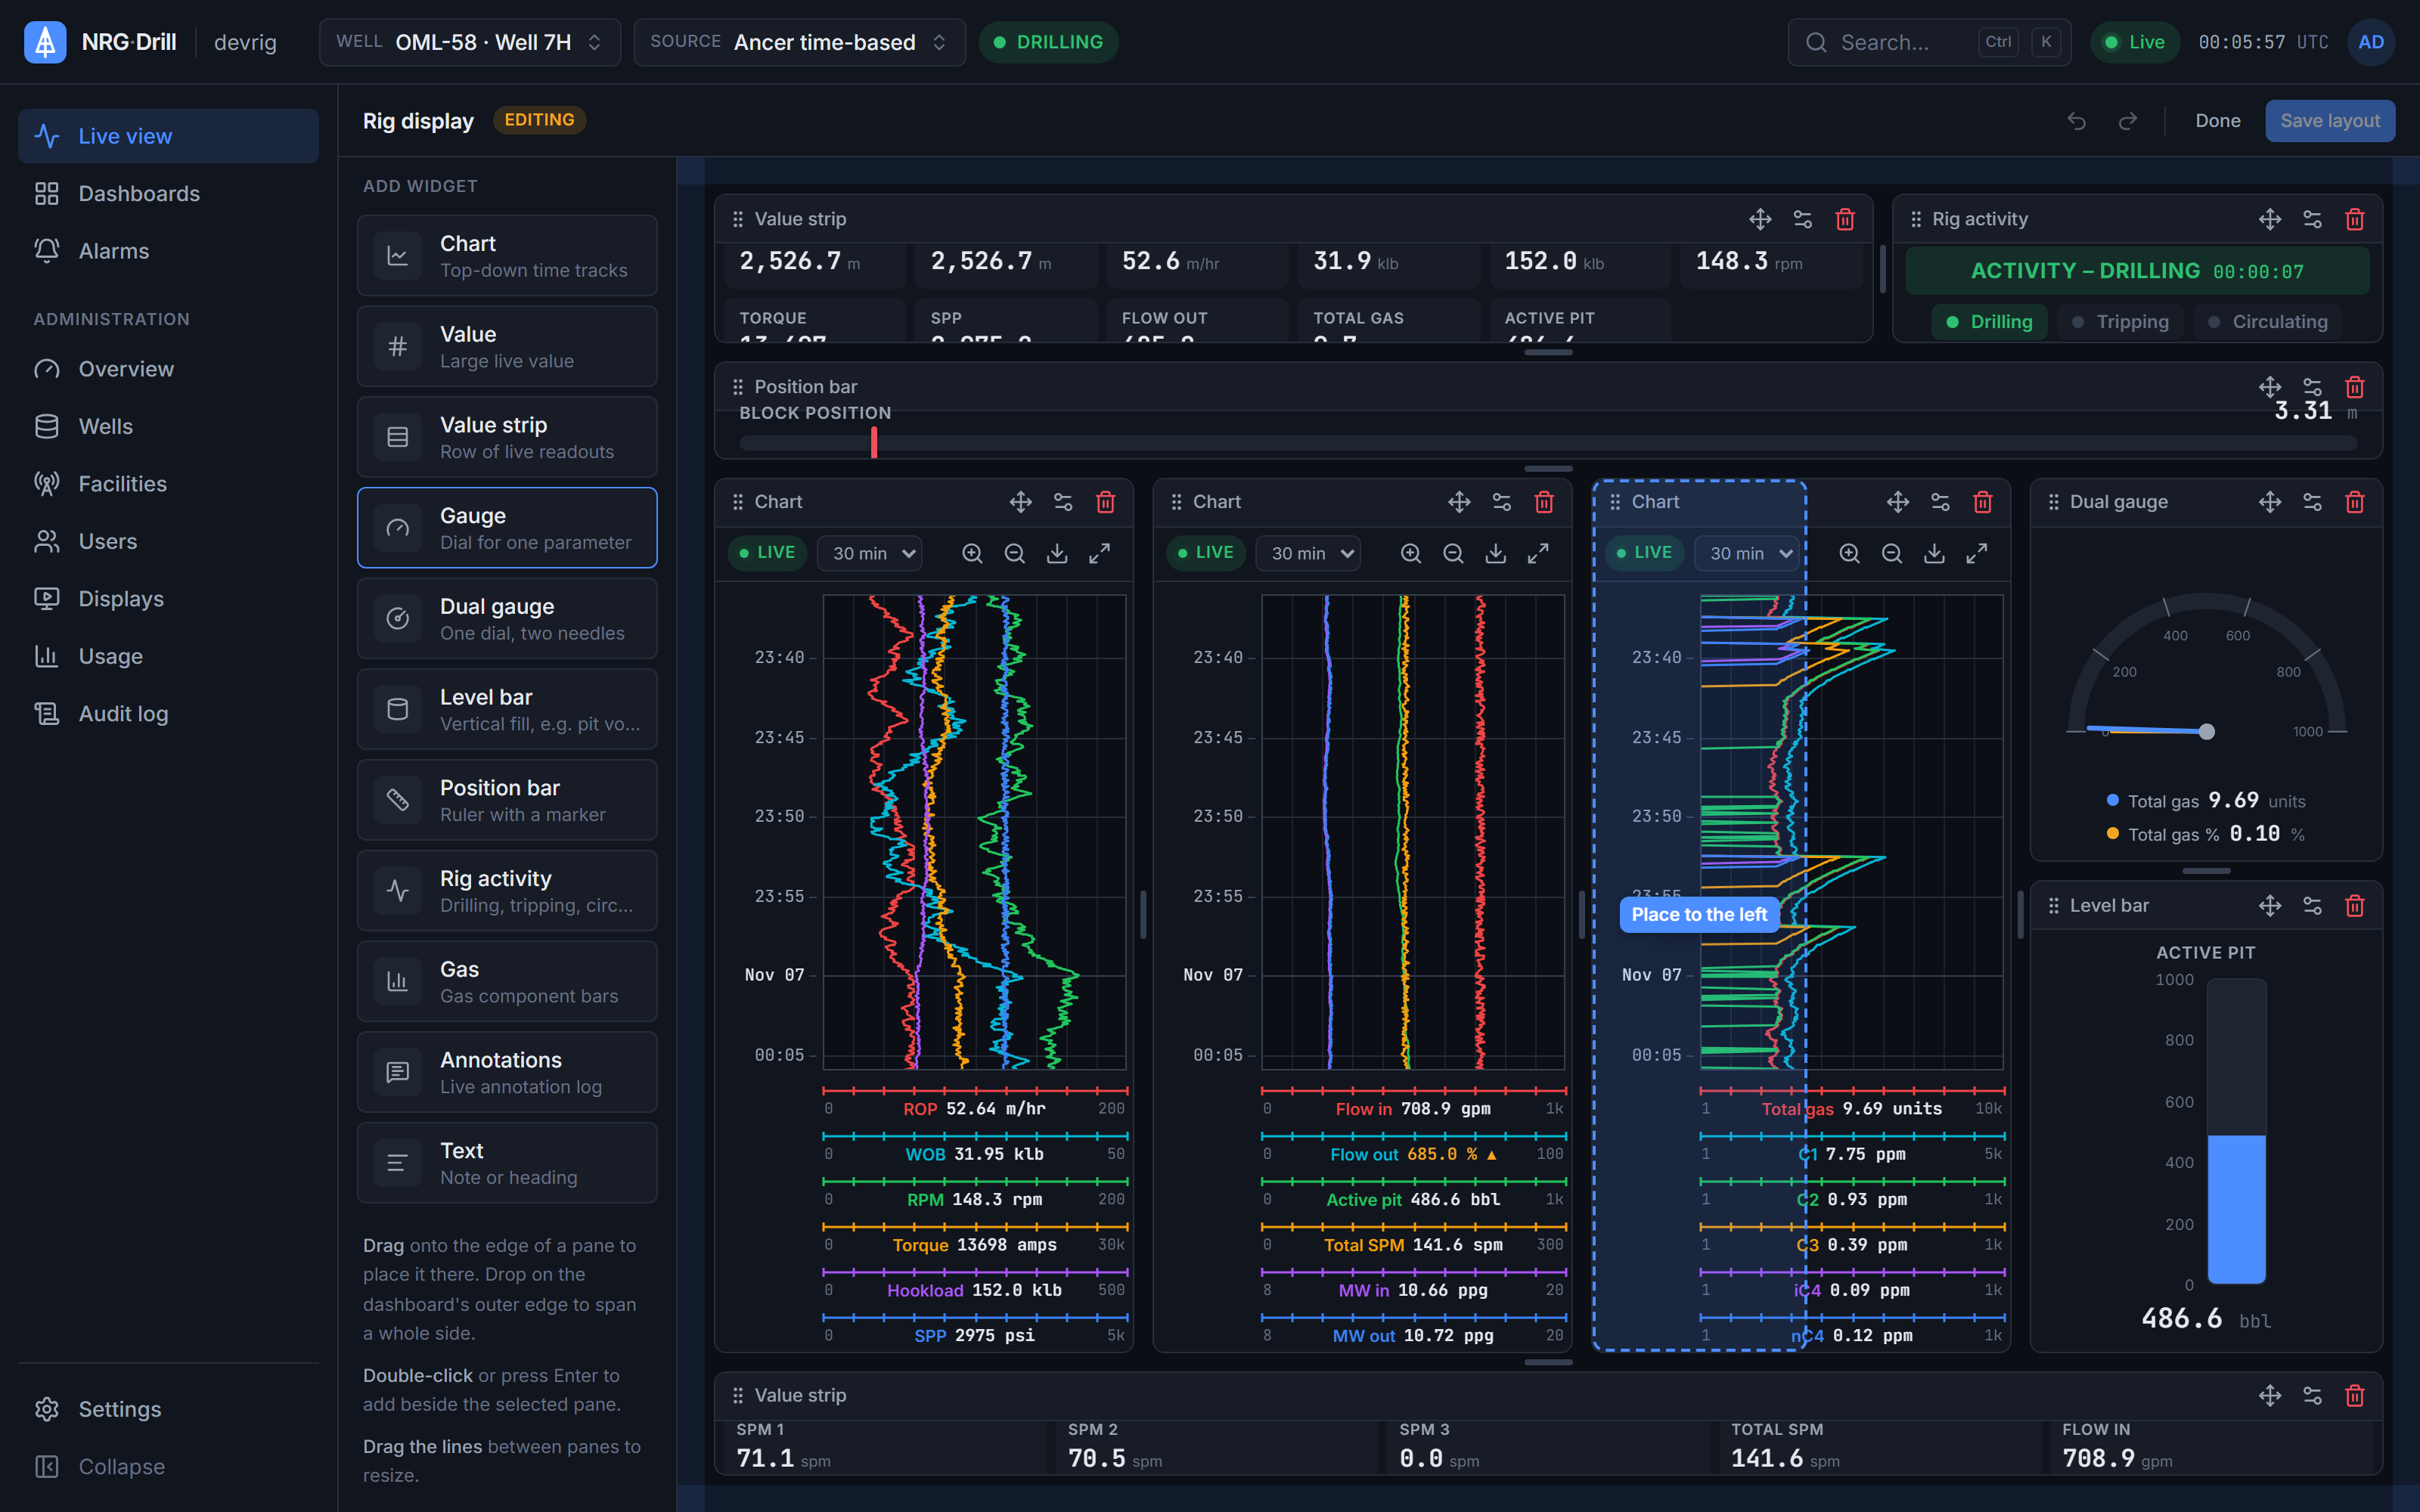
Charts, gauges, value strips, gas bars, level bars and annotation feeds, in a layout that always fills the screen. Start from the Rig display template or build your own, then share it with the whole organisation.
- Widgets
- 11 types
- Layout
- Split/docking, always fills the screen
- Sharing
- Organisation and personal
- History
- Undo and redo
- Portability
- JSON import and export
- Kiosk
- Full-screen view for displays
Dashboards
Build the screen your rig team already knows.
Charts, gauges, value strips, gas bars, level bars and annotation feeds, arranged in a split layout you resize by dragging. Start from the Rig display template or build your own.
Dashboard widgets
ROP
–
m/h
WOB
–
klb
RPM
–
rpm
Torque
–
kft·lb
SPP
–
psi
Flow in
–
gpm
SPP psi
Active pit
– bbl
Gas · %
Activity
Rotary drilling
Drop on an edge to split
A dashboard is a tree of row and column splits. Drag a widget onto the edge of a pane to split it, and drag the dividers to resize. The layout always fills the screen, so there are no gaps to tidy up.
- Undo and redo for every change
- Keyboard alternatives for every drag
- Panes stack into one column on narrow screens
Organisation and personal dashboards
Organisation dashboards are shared, only org admins can change them, and they're what wall displays show. Engineers and viewers can keep personal dashboards of their own. Admins can view anyone's and copy a good one to the organisation, but never edit it in place.
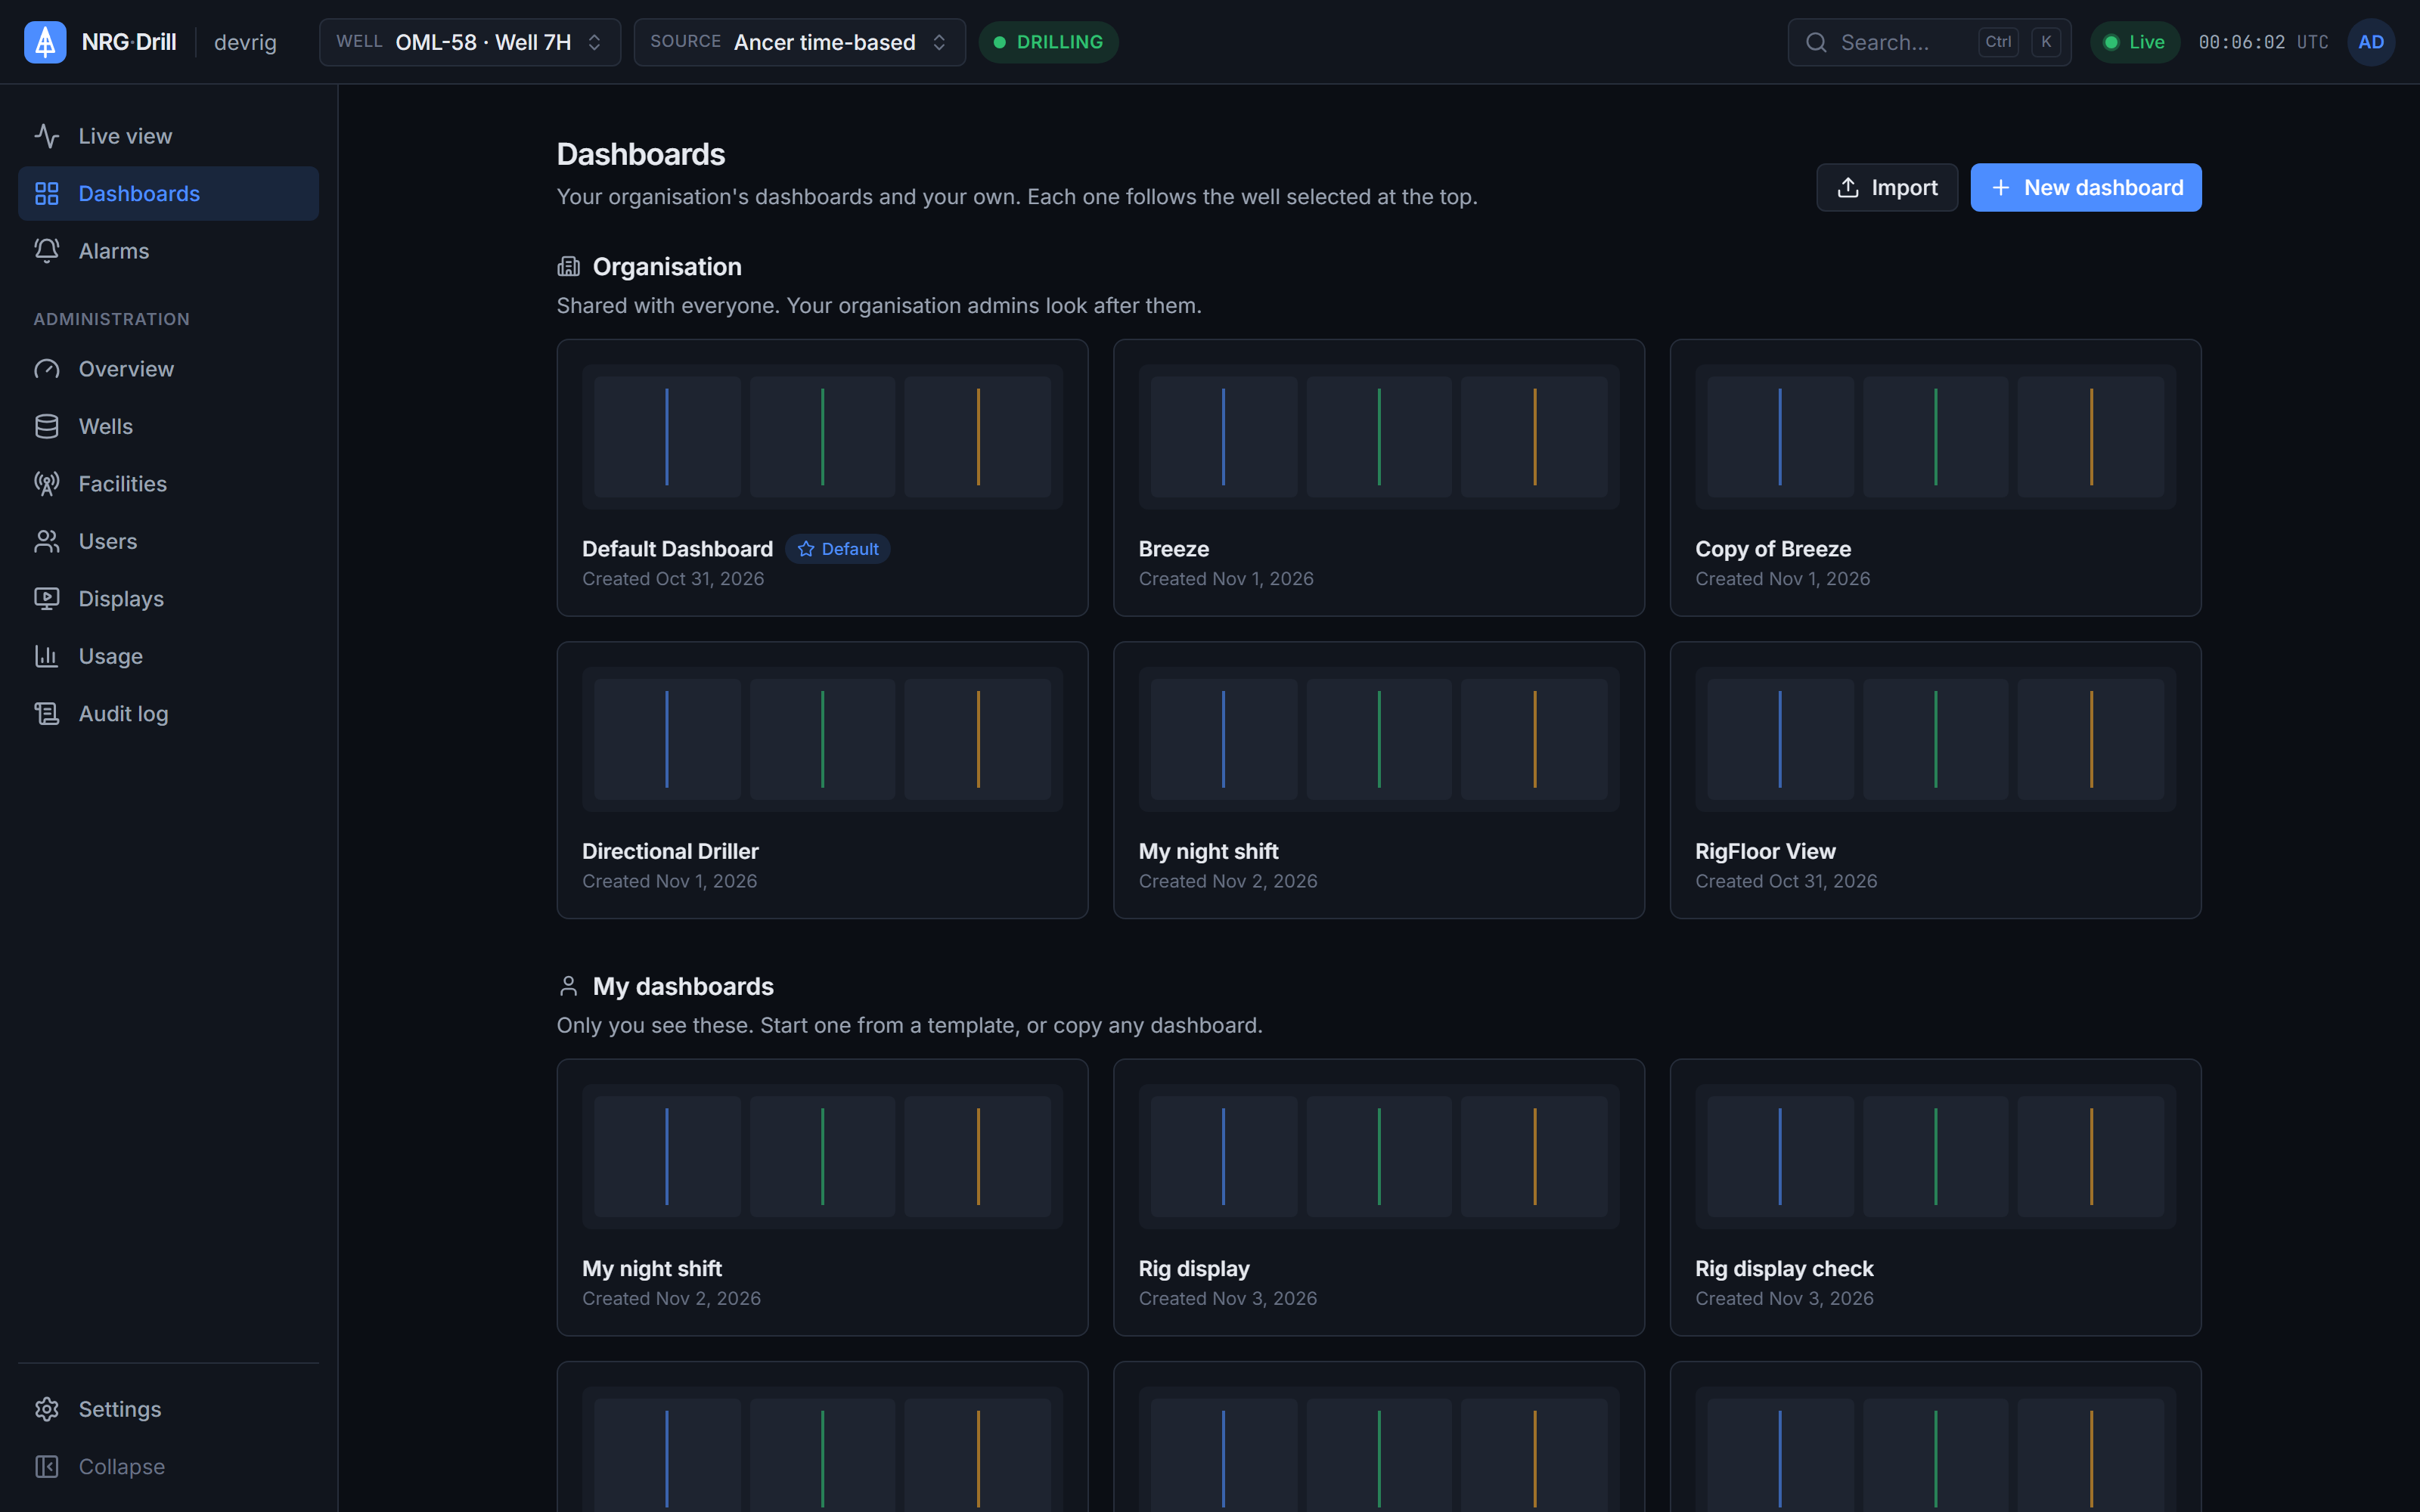
Start from a template
The Rig display template lays out the information from the legacy rig screens in a modern design. Clone it and adjust it, or start from scratch.
Take dashboards with you
Export any dashboard as JSON and import it elsewhere. Widgets find channels by name, so a dashboard built on Ancer data also works on a WITS source.
Widget catalogue
| Widget | What it shows | Channels |
|---|---|---|
| Chart | Top-down drilling chart, up to 4 tracks | Up to 6 per track |
| Gauge | 240° dial with limit bands | 1 |
| Dual gauge | One dial, two needles | 2 |
| Value strip | Header boxes or a compact pump strip | Up to 20 |
| Parameter label | One large reading | 1 |
| Drill status | Status pills or an activity banner | 3 |
| Gas bar | Gas components on a log scale | 9 |
| Position bar | Travel, e.g. the top drive | 1 |
| Level bar | A level with limits, e.g. active pit | 1 |
| Annotation feed | Notes from the rig and the office | — |
| Text | Headings and instructions | — |
Works with
Live charts
A top-down drilling chart in the browser — up to 4 tracks × 6 channels, Linear, Log10 and split scales, 48 hours of scroll-back and a shared time cursor.
Learn moreWall displays
Pair a TV or monitor with a one-time code. Wall displays get their own read-only sign-in for one well, show organisation dashboards in kiosk view, and don't count as users.
Learn moreData sources
The NRG-Drill Transmitter reads Ancer rig databases, WITS Level 0 (TCP or serial) and custom SQL, buffers through outages and sends compressed batches over outbound HTTPS.
Learn moreSee your own rig, live, this week.
Book a 30-minute demo. We’ll show NRG-Drill on a live well and talk through connecting your first cabin.